
A sales manager needs the pipeline report. Finance needs the monthly revenue view. Operations needs a backlog report. If finding each one means remembering a workspace name or asking for another link, the reporting experience has a navigation problem.
A landing page gives those people a shared starting point. In this guide, that means a directory of separate reports and apps, rather than the opening tab inside one report. The reports can keep their own data models, owners, and update schedules.
1. Start with the report map
Before choosing a tool, list the destinations people need. Record each report's business name, intended audience, owner, and approved viewing link. Keep the technical workspace name in your maintenance inventory; employees should not have to understand it to find their work.
Here is an illustrative structure for three teams. These are example names, not a customer deployment:
Company reporting
Finance
- Revenue → Monthly performance
- Costs → Budget vs. actual
Sales
- Pipeline → Opportunities
- Customers → Account performance
Operations
- Delivery → Backlog
- Service → Response times
Keep the first level short. Group destinations by the decisions people make, and add a sentence explaining what each report answers. Use deeper folders only when they make the next choice clearer. A second enormous list inside a folder does not solve the original problem.
2. Choose the approach that fits
| Approach | A good fit when… | What you maintain |
|---|---|---|
| Native Power BI app | You want a Microsoft-managed destination for related content and audiences. | App content, navigation, audience access, and the app’s update process. |
| Report with navigation links | You have a small set of destinations and want a custom visual starting page. | The report layout, destination URLs, and each destination’s access. |
| LumioBI portal | You want one curated menu across workspaces, available alongside native reports. | Portal navigation, approved users, and extension rollout; existing Power BI access remains separate. |
If a native app already gives your audience a clear experience, start there. A portal becomes useful when maintaining and navigating the collection is a recurring burden, especially across separate reporting areas.
3. Use a native Power BI app
Microsoft offers workspace apps and newer Org Apps. They are different app types, so first confirm which one your team uses. Org Apps support an overview page, navigation sections, links, and audiences. Included content comes from the app's workspace; adding a link to another destination is different from including that item.
For an Org App, the basic setup is:
- In a supported workspace, choose New → Org app and name it.
- Use Add content to select the supported items you want to include.
- Add an Overview and navigation Sections. Arrange the first item as the starting experience.
- Add links where needed, configure audiences and access, then save and share the app.
App creation and access changes require the appropriate workspace permissions. Consult Microsoft's Org Apps guide for current prerequisites and audience behavior.
For the example above, department-specific apps may be sufficient. Before introducing another tool, ask users to find a report outside their usual department. That exercise will reveal whether the app structure matches how people actually work.
4. Build a landing report with links
A small report can act as a visual directory. Each button opens a different report or app using its viewing URL. This can be a useful starting point when the destination list is short and changes infrequently.
- Collect the right links. Open each destination as its intended audience would. Use the app-context link if users receive access through that app.
- Create the starting page. In Power BI Desktop, add a page with a clear heading and the business categories from your report map.
- Add a button for each destination. Choose Insert → Buttons. Give each button a descriptive label, such as Monthly revenue.
- Connect the destination. In the button's formatting pane, enable Action, select Web URL, and enter the destination link. Test it with Ctrl-click while editing.
- Publish and verify. Share the landing report through your normal governed process, and check every link with a representative viewer account.
Use Web URL for a separate report. The Page navigation action moves between pages within the same report. Microsoft explains these actions in its button configuration guide.
The tradeoff is upkeep: moved or replaced reports need updated links, and the directory layout needs attention as the list grows. Give users an obvious way to return to the starting page after following a link. For a larger collection, a searchable directory or persistent navigation may be more useful than another row of buttons.
5. Organize the experience with LumioBI
LumioBI is another approach: administrators curate the navigation, and employees use a browser extension to keep that portal available while working in native Power BI. It is not a standalone embedded-report website. Plan the extension installation with your organization before rollout.
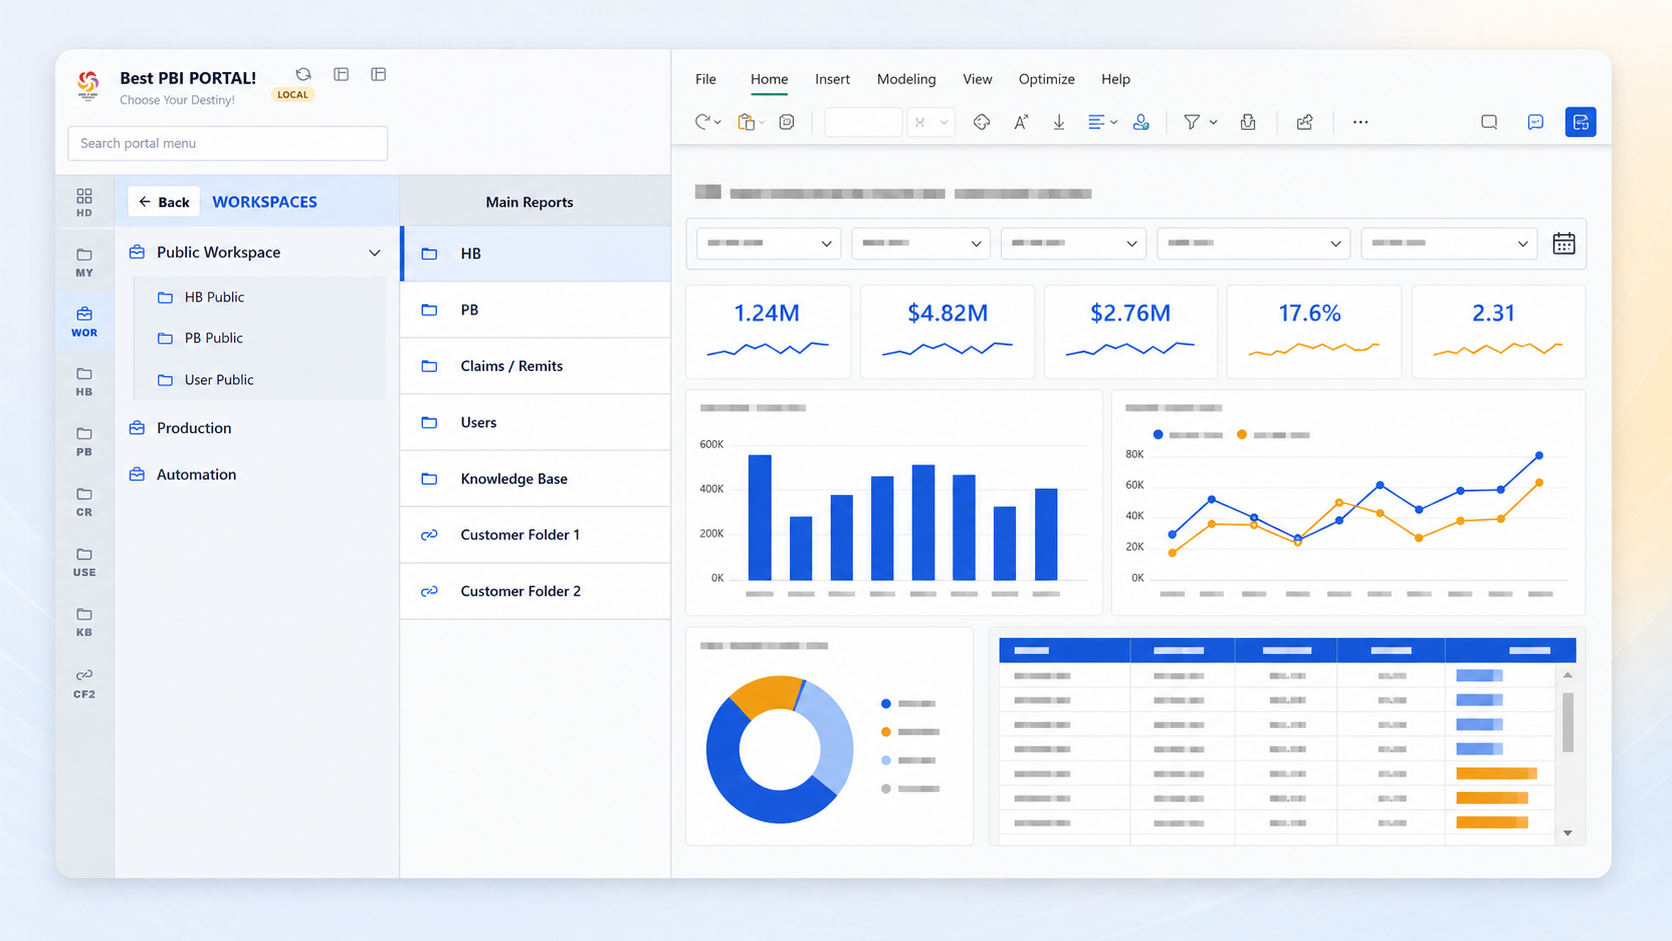
To translate the example report map into a portal:
- Create the structure. In LumioBI's Navigation editor, add Finance, Sales, and Operations folders, then their subfolders and report links.
- Make the menu relevant. Configure group visibility for the intended audience and add useful resources beside reports, such as metric definitions or a support link.
- Review and publish the navigation. Check the draft, then publish the portal configuration when it is ready for users.
- Walk through the employee experience. With the extension installed and the user approved for the portal, open Power BI, find Monthly performance in the menu or search, and save it as a favorite.
The benefit is continuity: employees can move between the reports you curate without repeatedly returning to a separate directory. Explore layered navigation and portal search to see the experience in more detail.
Navigation and report access are separate.
LumioBI's visibility rules organize the menu; they do not grant or revoke Power BI report permissions. Users still need the applicable Microsoft licensing and access to each destination. Hiding a link is not a replacement for securing the report.
6. Test the journey before you share it
Give someone outside the BI team three tasks: find a familiar report, find one from another business area, and return to the starting point. Watch where they hesitate. That is more useful feedback than asking whether the page looks good.
- Every report name describes a business question or task.
- Each link opens the intended report for an ordinary viewer, not only an administrator.
- People without permission remain unable to access restricted reports, even with a direct link.
- Users know how to return or switch to another report.
- A named owner will review broken links, retired content, and audience changes.
- The experience works in the browsers and devices your audience actually uses.
After launch, track successful report discovery and repeat use. Ask which links people still request by email. Use that feedback to simplify the structure before adding more destinations.
Common questions
Can a landing page point to reports in different workspaces?
Yes, a directory of viewing links can point to separate destinations. Each link still requires the viewer's existing access. A link does not move a report or combine its data with another report.
Does this combine several reports into one dashboard?
No. This guide organizes entry points to separate reports. Combining visuals or data into a single analytical view is a different design task.
Should I build a landing page or buy a portal?
Start with the smallest approach that meets your users' needs. A small, stable list may work well as an app or link page. Consider a managed portal when persistent navigation, search, audience-specific menus, and ongoing maintenance become important.
Put your report map to work
Give your team a clearer place to start.
Explore LumioBI's navigation and search, review the plans, or create a portal around the reports your organization already uses.
Written by LumioBI, the product described in this guide. Microsoft interfaces and requirements can change; refer to the linked documentation when configuring your environment. For a broader comparison, see Org Apps, embedded analytics, and LumioBI.